FOR IMMEDIATE RELEASE
Wednesday, January 15, 2025
Contact:
Rocky Moretti (202) 262-0714
Carolyn Bonifas Kelly (703) 801-9212
Click here for the full report, news conference recording, infographics and video interview footage with report authors.
NEW YORK CITY METRO MOTORISTS LOSE NEARLY $3,500 PER YEAR DRIVING ON ROADS THAT ARE ROUGH, CONGESTED & LACK SOME DESIRABLE SAFETY FEATURES – $38 BILLION STATEWIDE
New York, NY – Roads and bridges that are deteriorated, congested or lack some desirable safety features cost New York motorists a total of $38 billion statewide annually – $3,492 per driver in the New York-Newark-Jersey City urban area – due to higher vehicle operating costs, traffic crashes and congestion-related delays. A lack of adequate investment in transportation and increasing inflation in construction costs could hamper New York’s ability to make needed improvements to its transportation network, according to a new report released today by TRIP, a Washington, DC based national transportation research nonprofit.
The TRIP report, “New York Transportation by the Numbers: Providing a Modern, Sustainable Transportation System in the Empire State,” finds that throughout New York, nearly half of major locally and state-maintained roads are in poor or mediocre condition, nine percent of locally and state-maintained bridges (20 feet or more in length) are rated poor/structurally deficient, traffic congestion is choking commuting and commerce, and the state’s traffic fatality rate has increased significantly since 2019. The TRIP report includes statewide and regional pavement and bridge conditions, congestion data, highway safety data, and cost breakdowns for the Albany-Schenectady-Troy, Binghamton, Buffalo-Niagara Falls, New York-Newark-Jersey City, Poughkeepsie-Newburgh-Middletown, Rochester, Syracuse and Utica urban areas.
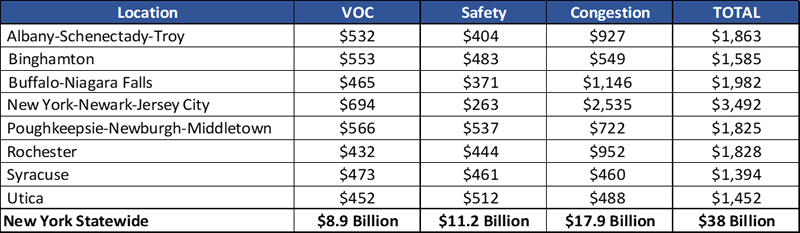
Driving on roads in the New York-Newark-Jersey City urban area costs the average driver $3,492 per year in the form of extra vehicle operating costs (VOC) as a result of driving on roads in need of repair, lost time and fuel due to congestion-related delays, and the costs of traffic crashes in which the lack of adequate roadway safety features, while not the primary factor, likely were a contributing factor. A breakdown of the costs per motorist in the state’s largest urban areas, along with a statewide total, is below.
The TRIP report finds that 46 percent of major locally and state-maintained roads in the New York-Newark-Jersey City urban area are in poor or mediocre condition, costing the average motorist an additional $694 each year in extra vehicle operating costs, including accelerated vehicle depreciation, additional repair costs, and increased fuel consumption and tire wear. Statewide, 45 percent of New York’s major roads are in poor or mediocre condition.
“Excessive wear and tear and damage to our vehicles, loss of productivity while sitting in traffic, and injury and even some deaths from unsafe road conditions are symptoms of an underfunded transportation system,” said Jeffrey Smith, president of the New York State County Highway Superintendents Association. “At a time when affordability of living and working in New York is a challenge, these extraordinary costs to motorists can be mitigated by increasing public investments in our state and local roads, bridges and culverts.”
In the New York-Newark-Jersey City urban area, six percent of bridges are rated poor/structurally deficient, with significant deterioration to the bridge deck, supports or other major components. Statewide, nine percent of New York’s bridges are rated poor/structurally deficient, the tenth highest share in the nation.
“The TRIP report highlights the urgent need for sustained and predictable funding to address New York’s transportation challenges,” said Joseph Alston, director of government affairs for The Business Council of New York State, Inc. “The deteriorating condition of our roads and bridges poses a significant threat to business operations, increasing costs and reducing economic competitiveness. The Business Council of New York State calls on state and federal leaders to prioritize transportation infrastructure investments to ensure a robust business environment, drive economic growth, and secure long-term prosperity for our state.”
Traffic congestion in the New York-Newark-Jersey City urban area causes 92 annual hours of delay for the average motorist and costs the average driver $2,535 annually in lost time and wasted fuel. New York-Newark-Jersey City drivers waste an average of 36 gallons of fuel per motorist annually due to congestion. Statewide, drivers lose $17.9 billion annually as a result of lost time and wasted fuel due to traffic congestion. Due to the Covid-19 pandemic, vehicle travel in New York dropped by as much as 45 percent in April 2020 (as compared to vehicle travel during the same month the previous year). By 2024, vehicle miles of travel in New York had rebounded to seven percent below 2019’s pre-pandemic levels. The New York State Department of Transportation (NYSDOT) estimates that vehicle travel in New York will increase by 23 percent by 2040.
“The Business Council of Westchester (BCW), the county’s largest business membership organization focusing on economic development and advocacy, has always stressed that the state needs to prioritize improving the region’s transportation infrastructure,” said John Ravitz, executive vice president and COO of the BCW. “It is especially critical that Westchester County has a strong, fiscally sound transportation network to serve as an important economic development tool for recruiting and retaining businesses in the county.”
Traffic crashes in New York claimed the lives of 5,375 people between 2019 and 2023. In the New York-Newark-Jersey City urban area, on average, 629 people were killed in traffic crashes each year from 2018 to 2022. The financial impact of traffic crashes in which the lack of adequate roadway safety features, while not the primary factor, were likely a contributing factor, was an average of $263 annually per each New York-Newark-Jersey City area driver – a total of $11.2 billion statewide. Nationwide, traffic fatalities began to increase dramatically in 2020 even as vehicle travel rates plummeted due to the COVID-19 pandemic, and the number of fatalities continued to increase in 2021. The number of fatalities in New York increased 19 percent from 2019 to 2023, from 934 to 1,111, while state’s fatality rate per 100 million vehicle miles of travel increased 29 percent between 2019 and 2023, from 0.75 to 0.97.
Improvements to New York’s roads, highways and bridges are funded by local, state and federal governments. From 2022 to 2023, capital investment by NYSDOT in state and locally owned road and highway pavements dropped 29 percent, while investment in state and locally owned bridges dropped by 20 percent. In addition to state transportation funding, the Infrastructure Investment and Jobs Act (IIJA), signed into law on November 2021, will provide $13.5 billion in federal funds to the state for highway and bridge investments in New York over five years, representing a 52 percent increase in annual federal funding for roads and bridges in the state over the previous federal surface transportation program. Federal funds currently support 40 percent of the revenue used by NYSDOT to fund highway and bridge improvements.
“We are calling for an additional $250 million in CHIPS funding to be included in the 2025-2026 State Budget, to help maintain safe and efficient travel for all New Yorkers. These funds will allow us to keep pace with the substantial increases in material and labor costs we have experienced over the past several years,” said Town of Brookhaven Highway Superintendent Dan Losquadro, New York State Association of Town Superintendents of Highways executive committee member.
The ability of revenue from New York’s motor fuel tax – a critical source of state transportation funds – to keep pace with the state’s future transportation needs is likely to erode as a result of increasing vehicle fuel efficiency, the increasing use of electric vehicles and inflation in highway construction costs. The Federal Highway Administration’s national highway construction cost index, which measures labor and materials cost, increased by 46 percent from the beginning of 2022 through the first quarter of 2024.
“Small businesses and the state’s economy depend on good quality infrastructure, and this report sheds important light on the need to invest wisely and efficiently in the state’s transportation system,” said Ashley Ranslow, New York State director for the National Federation of Independent Businesses (NFIB). “Small businesses continue to deal with rising costs from inflation, and cannot afford to navigate any additional financial challenges, including supply chain disruptions that can result from failing infrastructure.”
The efficiency and condition of New York’s transportation system, particularly its highways, is critical to the health of the state’s economy. In 2022 New York’s freight system moved 743 million tons of freight, valued at $1.3 trillion. From 2022 to 2050, freight moved annually in New York by trucks is expected to increase 66 percent by weight and 94 percent by value (inflation-adjusted dollars). The design, construction and maintenance of transportation infrastructure in New York supports approximately 319,000 full-time jobs across all sectors of the state economy. Approximately 3.5 million full-time jobs in New York in key industries like tourism, retail sales, agriculture and manufacturing are dependent on the quality, safety and reliability of the state’s transportation infrastructure network.
“New York’s transportation dollars are already being stretched thin by increased inflation in construction costs, and declining capital investments in the state and local transportation networks will make it harder to complete needed improvements,” said Dave Kearby, TRIP’s executive director. “It will be critical that the state adequately invest in its transportation network in order to provide a system that is smooth, safe and efficient.”