FOR IMMEDIATE RELEASE
Wednesday, June 21, 2023
Contact:
Rocky Moretti (202) 262-0714 (cell)
Carolyn Bonifas Kelly (703) 801-9212 (cell)
TENNESSEE TRAFFIC FATALITIES INCREASED 17 PERCENT FROM 2019 TO 2022; FATAL & SERIOUS TRAFFIC CRASHES IN TENNESSEE RESULTED IN $55 BILLION IN ECONOMIC AND QUALITY-OF-LIFE COSTS IN 2022
NEW REPORT EXAMINES CAUSES OF INCREASED TRAFFIC FATALITIES, POTENTIAL SOLUTIONS
Eds: This report’s Appendix includes 2019-2022 data for all 50 states and DC in the following categories: number of fatalities, fatality rate per 100 million vehicle miles of travel, vehicle miles traveled, percent change in each category from 2019-2022, and the 2022 cost of serious and fatal crashes in economic costs and quality of life costs.
Click here for the report, appendix and infographics.
Washington, D.C. – The number and rate of U.S. traffic fatalities surged in 2020 and 2021 and decreased slightly in 2022 from the previous year, but remained at a high level as vehicle travel returned to near pre-pandemic levels. This is according to a report released today by TRIP, a national transportation research nonprofit, entitled Addressing America’s Traffic Safety Crisis: Examining the Causes of Increasing U.S. Traffic Fatalities and Identifying Solutions to Improve Road User Safety. The report documents the increase in the number and rate of traffic fatalities from 2019 to 2022 at the national and state levels, examines causes for this increase, calculates the cost of fatal and serious traffic crashes, and prescribes a broad, comprehensive approach to reducing traffic fatalities in the U.S.
In April 2020, as most activity was curtailed in an effort to slow the spread of COVID-19, U.S. vehicle miles of travel (VMT) was 40 percent lower than April 2019. By the end of 2020, overall U.S. VMT was 11 percent lower than in 2019. Vehicle travel rebounded to four percent below pre-pandemic levels in 2021, and in 2022 rose to one percent below 2019’s pre-pandemic levels.
However, from 2019 to 2022, while vehicle travel decreased and then began to rebound, the number of traffic fatalities and the rate of traffic fatalities per 100 million VMT soared and has remained significantly higher than pre-pandemic levels. The number of U.S. traffic fatalities increased 19 percent from 2019 to 2022, from 36,096 to 42,795, and the nation’s fatality rate per 100 million VMT increased 22 percent during that time, from 1.11 to 1.35.
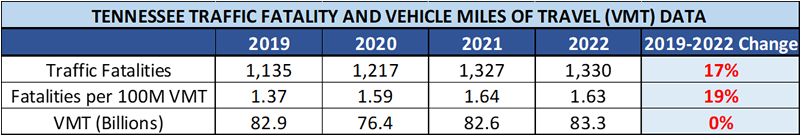
In Tennessee, from 2019 to 2022, the number of traffic fatalities increased 17 percent and the fatality rate per 100 million VMT increased 19 percent, while vehicle travel remained the same. Data for all states can be found in the Appendix.
Bicyclist and pedestrian fatalities, which accounted for 20 percent of all U.S. traffic fatalities in 2022, increased 19 percent from 2019 to 2022. From 2019 to 2022, the number of pedestrians killed increased 18 percent (from 6,205 to 7,345) and the number of bicyclists killed increased 26 percent (from 846 to 1,068).
U.S. motorcyclist fatalities increased by 20 percent from 2019 to 2022, from 5,015 to 6,000. This coincides with the rise in the share of motorcyclists who reported not wearing helmets, which increased from 17 percent to 29 percent from 2019 to 2021. While motorcycle travel accounted for 0.6 percent of annual VMT in 2021, motorcyclists represented 14 percent of traffic fatalities.
Traffic result in a significant economic burden. According to a 2023 National Highway Traffic Safety Administration (NHTSA) report, the tangible economic costs of traffic crashes include medical care, lost productivity, legal and court costs, insurance administrative costs, workplace costs, congestion impacts (travel delay, excess fuel consumption and pollution), emergency services, and property damage. NHTSA has also estimated the annual value of the lost quality-of-life cost of traffic crashes causing serious injury or death. The lost quality-of-life costs include the loss of remaining lifespan, extended or lifelong physical impairment, or physical pain.
Based on NHTSA’s traffic crash cost methodology, TRIP estimates that fatal and serious traffic crashes in Tennessee in 2022 caused a total of $55 billion in the value of societal harm, which includes $14 billion in economic costs and $41 billion in quality-of-life costs.
“Saving lives on our nation’s roadways requires teamwork – from the drivers who travel our roads to the governments that fund road work to the manufacturers, contractors and innovators involved. We must all commit to doing our part to reduce the loss of life and serious injuries on American roadways that cost an estimated $1.9 trillion last year and inflicted never-ending pain on families,” said American Traffic Safety Services Association (ATSSA) Board of Directors Chairman Jeff Johnson. “For our part, at ATSSA, we will not rest until we achieve the goal of zero deaths on U.S. roadways.”
The significant increase in traffic fatalities since the onset of the pandemic appears largely related to increased risks being taken by drivers. In an October 2021 report, the National Highway Traffic Safety Administration found that “after the declaration of the public health emergency in March 2020, driving patterns and behaviors in the United States changed significantly. Of the drivers who remained on the roads, some engaged in riskier behavior, including speeding, failure to wear seat belts, and driving under the influence of alcohol or drugs.”
The AAA Foundation for Traffic Safety (AAAFTS) drew similar conclusions about the role of increased risks being taken by drivers during the pandemic. A survey taken of drivers in October and November 2020 by the AAAFTS asked whether their level of driving had decreased, remained the same or increased since the beginning of COVID-19 related restrictions, and whether the motorist had engaged in a variety of risky driving behaviors in the previous 30 days. In a February 2022 brief about the survey, the AAAFTS noted that drivers who maintained or increased their pre-COVID travel levels indicated that they were more likely to engage in risky driving behavior, including speeding, not wearing a seat belt, being impaired and driving aggressively. “It is possible that many of the individuals who were willing to travel—and even increase their travel—despite the health risks associated with the pandemic were already more willing than average to take other risks,” the AAAFTS report found.
Data from the National Highway Traffic Safety Administration (NHTSA) indicates the number of people killed in police-reported alcohol involved crashes increased 22 percent from 2019 to 2022. The number of passenger vehicle occupants not wearing seatbelts who were killed increased 20 percent from 2019 to 2022.The share of adult front-seat passengers wearing seat belts reached 92 (91.6) percent in 2022, an increase from 91 (90.7) percent in 2019. NHTSA data also found that the number of people killed in speeding-related traffic crashes climbed 23 percent from 2019 to 2022, and represented 27 percent of U.S. traffic fatalities in 2022. From 2019 to 2021, the number of fatalities in distraction affected traffic crashes increased by 13 percent, from 3,119 to 3,522. From 2019 to 2021, traffic fatalities in U.S. highway work zones increased by 13 percent, from 845 to 956.
To combat the increase in fatalities, in early 2022 the U.S. Department of Transportation adopted a comprehensive National Roadway Safety Strategy, a roadmap for addressing the nation’s roadway safety crisis based on a Safe System approach, which is also being adopted by state and local transportation agencies. The objectives and elements of the approach include the following:
Safer People: Encourage safe, responsible behavior through education on speeding, impaired driving, safe pedestrian and bicycling behavior; extension of safety belt laws and enforcement; and enhanced enforcements and penalties for speeding and impaired, aggressive or distracted driving.
Safer Roads: Design roadway environments to mitigate human mistakes, account for injury tolerances, encourage safer behaviors, and facilitate safe travel by the most vulnerable users.
Safer Vehicles: Expand the availability of vehicle systems and features that help to prevent crashes and minimize the impact of crashes on both occupants and non-occupants. Support the development, testing and deployment of connected and autonomous vehicle technology such as collision avoidance, lane departure avoidance systems and turning detection systems.
Safer Speeds: Where appropriate, provide roadway features to encourage safer speeds, including traffic roundabouts and curb extensions; improved signage and dynamic speed signing at high-risk locations; education on the consequences of speeding; and increased speeding enforcement, particularly at high-risk locations.
Post-Crash Care: Enhance the survivability of crashes through expedient access to emergency medical care, create a safe working environment for vital first responders by preventing secondary crashes through robust traffic incident management practices, increase access to level one or two trauma centers for seriously injured crash victims.
Consistent with the Safe System approach, safety at highway work zones can be improved by implementing a comprehensive work zone safety strategy that includes ensuring a proper work zone layout; prioritizing work zone safety training; ensuring the use of high visibility safety apparel and appropriate traffic control devices; creating an internal traffic control plan; and implementing strategies to reduce aggressive driving.
“The approaches to transportation safety that got us to this point are clearly not delivering the impact they once did,” said Jake Nelson AAA director of traffic safety advocacy and research. “With record-setting investment in our nation’s transportation system, we have a real-time opportunity to leverage it to turn the tide on traffic deaths and serious injuries among road users.”
Increasing investment in roadway safety improvements is likely to pay off in the form of reduced fatal and serious traffic crashes. The U.S. has a $146 billion backlog in needed roadway safety improvements, according to a 2017 report from the AAAFTS. The report found implementing cost-effective and needed roadway safety improvements on U.S. roadways would save approximately 63,700 lives and reduce the number of serious injuries as a result of traffic crashes by approximately 350,000 over a 20-year period.
Additional funding for improved roadway safety has been provided by the bipartisan Infrastructure Investment and Jobs Act (IIJA), which was signed into law in November 2021 and provides a significant boost in federal investment in roads, bridges and transit, and offers an opportunity for the nation to make progress in improving the safety, reliability and condition of America’s transportation system. The IIJA provides $454 billion over the five-year period from 2022 to 2026 for investment in highways and transit, resulting in a 38 percent increase in federal investment starting in 2022.
The IIJA provides additional resources to address traffic safety, including the following programs: $6 billion for the Safe Streets and Roads for All program; $17 billion for the Highway Safety Improvement Program (HSIP); $4 billion for improved crash data and vehicle, behavior, and truck safety programs; $300 million for rural road safety; and $120 million for tribal road safety.
“Making a commitment to eliminating fatal and serious injuries on the nation’s roadways will require robust investment and coordinated activities by transportation and safety-related agencies in providing the needed layers of protection for the nation’s motorists, pedestrians and bicyclists, including safe road users, safe roads, safe vehicles, safe speeds and high-quality post-crash care,” said Dave Kearby, TRIP’s executive director.