FOR IMMEDIATE RELEASE
Monday, February 3, 2020
Report available at: tripnet.org
Contact:
Carolyn Bonifas Kelly 703.801.9212 (cell)
Rocky Moretti 202.262.0714 (cell)
TRIP office 202.466.6706
TRIP spokespersons are available for phone or Skype interviews throughout the day.
Local speakers are also available in Richmond by arrangement.
RICHMOND AREA MOTORISTS LOSE MORE THAN $1,500 PER YEAR ON ROADWAYS THAT ARE ROUGH, CONGESTED & LACK SOME DESIRABLE SAFETY FEATURES – $9.5 BILLION STATEWIDE. LACK OF SUSTAINABLE, LONG-TERM FUNDING THREATENS VIRGINIA’S ABILITY TO IMPROVE ROAD AND BRIDGE CONDITIONS, IMPROVE TRAFFIC SAFETY, AND RELIEVE CONGESTION ON A TRANSPORTATION SYSTEM CARRYING GROWING TRAFFIC VOLUMES.
Eds.: The report includes pavement and bridge condition, congestion and highway safety data, as well as cost breakdowns for the Hampton Roads, Northern Virginia, Richmond and Roanoke urban areas and statewide. Info-graphics can be downloaded here.
Richmond, VA – Roads and bridges that are deteriorated, congested or lack some desirable safety features cost Virginia motorists a total of $9.5 billion statewide annually – $1,502 per driver in the Richmond urban area – due to higher vehicle operating costs, traffic crashes and congestion-related delays. A lack of sustainable, long-term transportation funding threatens Virginia’s ability to improve road and bridge conditions, improve traffic safety, and relieve traffic congestion and could be an impediment to economic growth in the state, according to a new report released today by TRIP, a Washington, DC based national transportation research nonprofit.
The TRIP report, “Virginia Transportation by the Numbers: Meeting the State’s Need for Safe, Smooth and Efficient Mobility,” finds that throughout Virginia, approximately one third of major locally and state-maintained roads are in poor or mediocre condition, more than 600 locally and state-maintained bridges (20 feet or more in length) are rated poor/structurally deficient, and 3,875 people lost their lives on the state’s roads in traffic crashes from 2014-2018. The report also finds that travel on Virginia’s roadways has increased by 14 percent from 2000 to 2018 and six percent from 2013 to 2018, resulting in increasing traffic congestion, causing significant delays and choking commuting and commerce.
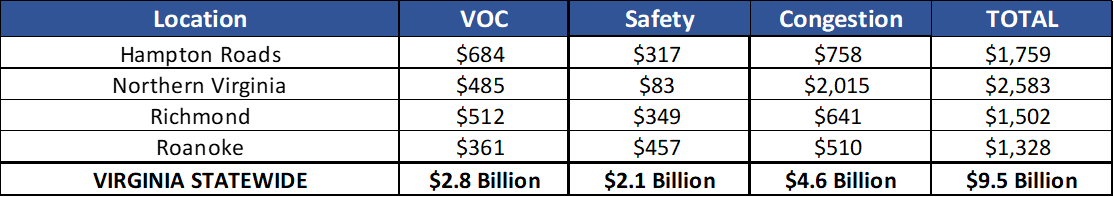
Driving on roads in the Richmond area costs the average driver $1,502 per year in the form of extra vehicle operating costs (VOC) as a result of driving on roads in need of repair, lost time and fuel due to congestion-related delays, and the costs of traffic crashes in which roadway features likely were a contributing factor. A breakdown of the costs per motorist in the state’s largest urban areas, along with a statewide total, is below.
The report also finds that Virginia’s current sources of transportation revenues will not keep pace with the state’s future transportation needs. This is largely a result of increasing vehicle fuel efficiency and the increasing use of electric vehicles, which, combined, are expected to reduce significantly the revenue generated by the state’s motor fuel tax revenues. Average fuel efficiency for passenger vehicles in the U.S. has increased by 20 percent over the last decade and is expected to increase by 31 percent by 2030 and 51 percent by 2040. And, electric vehicles, which now account for two percent of passenger vehicles in Virginia, are expected to increase to 46 percent of passenger vehicles in Virginia by 2040. As a result of increased fuel efficiency and the adoption of electric vehicles, gasoline and diesel consumption in Virginia is expected to decrease 23 percent by 2030, and 51 percent by 2040. This decline is expected to decrease Virginia’s state motor fuel tax receipts by 34 percent by 2030 and 62 percent by 2040. State diesel fuel tax receipts are expected to decrease 24 percent by 2030 and 50 percent by 2040.
“The lack of adequate, sustainable transportation funding in Virginia will lead to increasing deterioration on the state’s roads and bridges and even longer congestion-related delays for commuters, businesses and visitors,” said Will Wilkins, TRIP’s executive director. “Deteriorated, congested roads rob drivers of time and money while reducing the state’s competitive advantage and threatening economic growth. Making investments that will improve the condition and efficiency of Virginia’s transportation system will ensure that the state remains an attractive place to live, visit and do business.”
The TRIP report finds that 17 percent of major locally and state-maintained roads in the Richmond urban area are in poor condition and another 30 percent are in mediocre condition, costing the average motorist an additional $512 each year in extra vehicle operating costs, including accelerated vehicle depreciation, additional repair costs, and increased fuel consumption and tire wear. Statewide, 12 percent of Virginia’s major roads are in poor condition and 22 percent are in mediocre condition.
A total of 646 Virginia bridges (20 feet or longer) are rated poor/structurally deficient, with significant deterioration to the bridge deck, supports or other major components. More than eight thousand (8,499) of the state’s bridges are rated in fair condition and the remaining 4,786 are in good condition. Fifty-nine of the state’s 646 poor/structurally deficient bridges are in the Richmond area.
Traffic congestion in the Richmond area is worsening, causing 35 annual hours of delay for the average motorist and costing the average Richmond driver $641 annually in lost time and wasted fuel. Statewide, congestion costs Virginia drivers a total of $4.6 billion annually.
Traffic crashes in Virginia claimed the lives 3,875 people between 2014 and 2018. Virginia’s overall traffic fatality rate of 0.96 fatalities per 100 million vehicle miles of travel in 2018 was lower than the national average of 1.13. The fatality rate on Virginia’s non-interstate rural roads in 2018 was approximately three times higher than on all other roads in the state (2.05 fatalities per 100 million vehicle miles of travel vs. 0.63). In the Richmond area, on average, 96 people were killed in traffic crashes each year from 2015 to 2018. The financial impact of traffic crashes in which the lack of adequate roadway safety features was likely a contributing factor was an average of $349 annually per each Richmond area driver.
The efficiency and condition of Virginia’s transportation system, particularly its highways, is critical to the health of the state’s economy. Annually, $497 billion in goods are shipped to and from Virginia, relying heavily on the state’s network of roads and bridges. Increasingly, companies are looking at the quality of a region’s transportation system when deciding where to re-locate or expand. Regions with congested or poorly maintained roads may see businesses relocate to areas with a smoother, more efficient and more modern transportation system. Approximately 112,000 full-time jobs in Virginia in key industries like tourism, retail sales, agriculture and manufacturing are dependent on the quality, safety and reliability of the state’s transportation infrastructure network.